Big Data x ESG = Innovation
.jpg)
The Top500
Overview of the Top500 project
The Top500 project is designed to provide ESG intelligence for the top 500 listed firms in Hong Kong based on ESG iScore. Our i-Composite Scorecard v1.0 was created in August 2023 to showcase the Top100(v1.0) from the Top500 universe. The Scorecard v1.0 adopts a ranking mechanism based on absolute i-Composite score. The Scorecard v2.0 employs a different ranking mechanism by integrating peer benchmarking into the methodology. The v2.0 system also compares the Top100(v2.0) with the Bottom100(v2.0) in the scorecard. Eventually, the Scorecard v3.0 is updated using data as of 2023 year end with the complete list of the Top500 released. The ultimate objective of the project is to provide information transparency to the professional investors and public about the ESG performance of listed firms in Hong Kong through a big data analytical framework.
The Top100 i-Composite Scorecard v1.0
Purpose of the Top 100 i-Composite Scorecard
We promote big data analytics through a technology-driven ESG sentiment indicator by adopting social listening measures for listed companies. The goal of the Scorecard is designed to demonstrate the importance of a more dynamic ESG performance measure at firm level. The current Top100 i-Composite Scorecard v1.0 is a static snapshot capturing past performance using an integrated measure of ESG performance and ESG sentiment. Future versions are expected to capture the time-varying dynamics of the i-Composite.
Methodology
1. Compute iScore (2022) for all HK listed firms with matching RavenPack sentiment score (RP Senti) and Youjivest sentiment score (YJV Senti), resulting in 498 firms as the i-Composite universe. 2. The data used for ESG ratings is as of December 2022, which reflect the latest ESG performance of the firms reported by the data providers. For the sentiment data, we employ a 15-month rolling period up to March 2023. Both sentiment data providers use a proprietary weighting scheme to reflect the relative importance of recent media coverage. 3. Based on the i-Composite universe, we perform simulations for various weightings among iScore and the two sentiment scores to determine optimal weights to form the composite indicator. Our optimization KPI is based on subjective sensitivity analysis of how the various weightings may affect the ranking of the top 100. 4. Our simulation result concludes that the optimal weighting scheme should follow a range of 70-80% for the iScore, and remaining 20-30% to be allocated to the sentiment components. Our current weighting scheme follows this guideline. 5. Then we compute the top 100 list based on the i-Composite indicator (theoretical range is -3 to 10). This is our Top100 i-Composite Scorecard v1.0.
Data Construction
The i-Score

Step 1:
To obtain several ESG scores of each stock
-
Evaluate different ratings/scores from a third-party data provider.
-
Make sure that the ESG ratings used are based on performance but not risk- or disclosure-based.
Step 2:
To generate the divergence factor
-
The “Aggregate Confusion Hypothesis” suggests that the rating divergence comes from 3 aspects: Scope, Rater, and Weighting differences. We argue that ESG analysts employed by different ESG data providers are subjected to regional and corporate culture influence in rating companies, leading to the divergence.
-
For each stock, we compute a divergence factor based on various ESG ratings of each firm from providers of different regions to capture the divergence effect.
Step 3:
To compute the i-Score
-
We compute the i-Score for each firm by scaling the ESG rating by the divergence factor generated in step 2.
Capturing the Sentiment
The sentiment is based on media coverage of ESG/sustainability topics. The commercial data providers employ Natural Language Processing (NLP) algorithms to capture the positive and negative sentiment of the articles based on a prescribed list of ESG key words. In our case, we focus on the net sentiment (positive minus negative). Each of the net sentiment score (Net Senti) ranges between -10 (negative) and +10 (positive), which reflects how professionals perceive the ESG information from the media coverage in a given period.
Descriptive characteristics of the Top100 (v1.0)
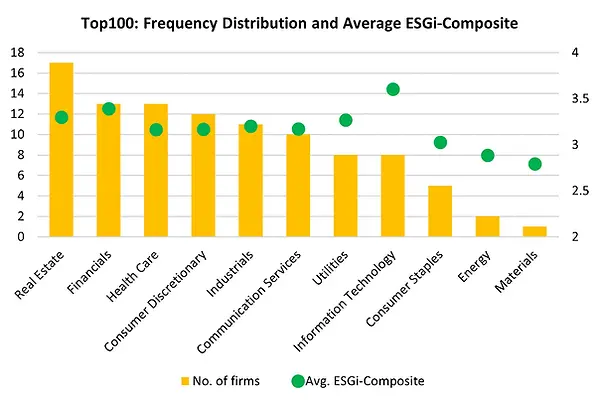
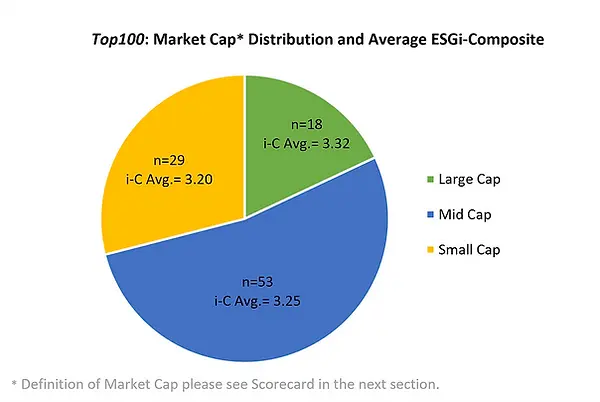

The Top100 i-Composite Scorecard v1.0
The Scorecard can be sorted by each firm characteristic using desktop browser.
For mobile view, the default order is arranged by overall ESGi-Composite ranking and can be sorted by stock code only.
Refresh the page to see the default order again.
* Large Cap: >HKD100billion; Mid Cap: HKD10-100bilion; Small Cap: <HKD10billion. As of end of 2022.
The Top100 i-Composite Scorecard v2.0
What is new about the Top100 i-Composite Scorecard v2.0 and its methodology
The Scorecard v2.0 employs a different ranking mechanism by integrating peer benchmarking into the methodology. We believe that this is an improvement from v1.0 as it is based on absolute i-Composite score, and therefore, subject to potential industry bias. The peer benchmarking procedure ensures each industry sector (GICS 1) would have a fair representation in the ranking construction process. In addition, we have two more enhancements in our data. First, we expand the news sources (both mainstream news and social media) for Youjivest. Second, we expand the time period for both sentiment data which now cover the period of January 2022 – March 2023. The v2.0 system also compares the Top100(v2.0) with the Bottom100(v2.0) in the scorecard. Eventually, we aim to release the complete list of the Top500.
Descriptive characteristics of the Top100 (v2.0)


The i-Composite Scorecard v2.0
The Top100 (v2.0)
The Scorecard can be sorted by each firm characteristic using desktop browser.
For mobile view, the default order is arranged by overall ESGi-Composite ranking and can be sorted by stock code only.
Refresh the page to see the default order again.
The Bottom100 (v2.0)
The Scorecard can be sorted by each firm characteristic using desktop browser.
For mobile view, the default order is arranged by overall ESGi-Composite ranking and can be sorted by stock code only.
Refresh the page to see the default order again.
The Top500 i-Composite Scorecard v3.0
What is new about the Top500 i-Composite Scorecard v3.0 and its methodology
Entering a new year of 2024, we have refreshed the raw data used in calculation of the i-Composite Scorecard v3.0, for both ESG and sentiment components. The data used for ESG ratings is updated as of December 2023, which reflects the latest ESG performance of the firms reported by the data providers. For the sentiment data, we employ a 12-month period during Jan-Dec 2023 for generating sentiment indicators from data vendors. In addition to the improved timeliness and transparency, the Scorecard v3.0 also employs a similar ranking mechanism to v2.0, i.e., integrating peer benchmarking into the methodology. This enables better year-on-year comparison of Top100 and Bottom100 characteristics between v2.0 and v3.0.
Descriptive characteristics of the Scorecard v3.0


The i-Composite Scorecard v3.0
The Top500 (v3.0)
The Scorecard can be sorted by each firm characteristic using desktop browser.
For mobile view, the default order is arranged by overall ESGi-Composite ranking and can be sorted by stock code only.
Refresh the page to see the default order again.
AH Shares Firm List with YoujiVest ESG Sentiment Ratings Based on Negative ESG News Sentiment Using Chinese Language Media
2023
Rationale of using negative sentiment for forming portfolio
-
YoujiVest ESG sentiment focuses on negative sentiment of ESG news appearing in Chinese mainstream media for AH shares.
-
Even though these shares are dually listed in Hong Kong and Mainland China, we focus our alpha generation using stock return from Hong Kong shares only.
-
YoujiVest has done extensive in-house research for the A shares market using Chinese language NLP and machine learning algorithm to test both positive and negative sentiment from news media and public document information. They have concluded that positive news in China has no relationship with alpha generation but negative news indicates a stronger relationship with stock return.
Important Disclaimer
The scorecard is prepared for the Innovation and Technology Fund (ITF) project (GSP/033/22) operated under the Research Centre for ESG (CESG) at the Hang Seng University of Hong Kong.
The scorecard should be used only as a reference in understanding the historical ESG performance of the entity concerned. It is not an offer to sell or solicitation for an offer to buy any financial products and services, and they should not be considered as investment advice. The data components provided by the related third-party vendors, the Research Centre for ESG of Hang Seng University of Hong Kong and the research team accept no responsibility or liability for the accuracy and completeness of such information.
Any opinions, findings, conclusions or recommendations expressed in this material/event (or by members of the project team) do not reflect the views of the Government of the Hong Kong Special Administrative Region, the Innovation and Technology Commission or the Vetting Committee of the General Support Programme of the Innovation and Technology Fund.